Tabular Data Manager: Analyse
From Gcube Wiki
Revision as of 12:14, 22 May 2015 by Giancarlo.panichi (Talk | contribs) (Created page with '== Analyse == Tabular Data Manager, Analyse tab === Chart Menu === ==== Create Chart ==== : Create charts from a Tabular R…')
Contents
Analyse

Tabular Data Manager, Analyse tab
Chart Menu
Create Chart
- Create charts from a Tabular Resource. Note, after a chart has been created it becomes available in the list of resources of the Tabular Resource.

Tabular Data Manager, Charts Create
Process Menu
R studio
- The current Tabular Resource is exported in R-Studio.
Statistical
- You can use statistical algorithms clicking on the current tabular resource clicking on Statistical button. A statistical algorithm can produce new tabular resources or new resources. The new tabular resources can be accessed via the Open button, while new resources are accessible through Resources button in properties.
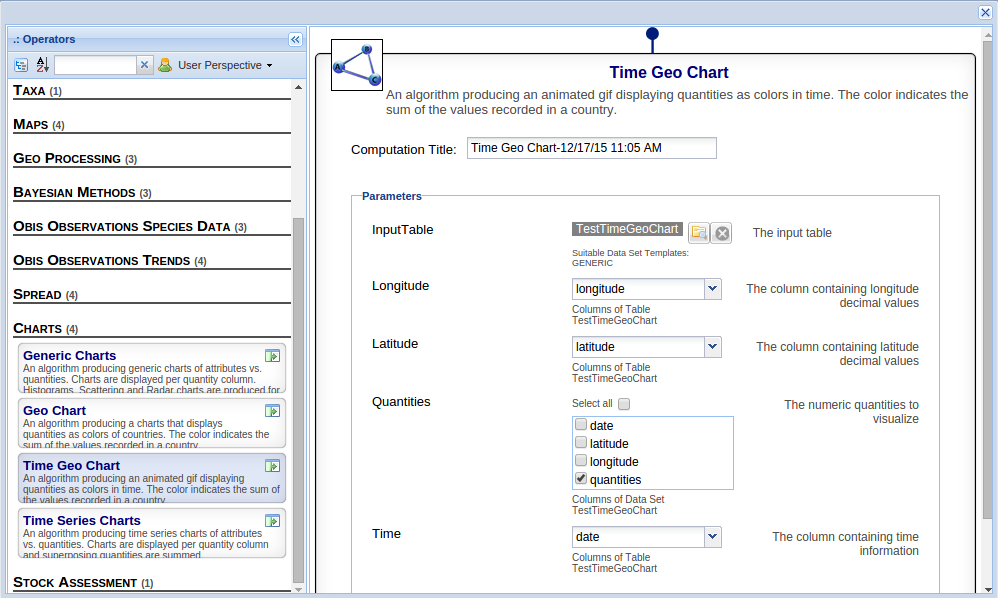 Tabular Data Manager, statistical

GIS Menu
Create Map
- Create map from a Tabular Resource. Note, after a map has been created it becomes available in the list of resources of the Tabular Resource.
Grid Menu
- A column and a context menu, are available directly on your tabular resource. By using the column menu, which appear in each column header, you can access to the main functionalities, present in the tabs of the ribbon bar (see image in the section Column Menu). On the other hand, the right click on the cell allows to execute basic operations (see image of the section Contex Menu)
- Example of the Grid Header Column Menu

- Example of the Context Menu
