Difference between revisions of "Monitoring System"
(→Configuring Advanced Monitoring) |
(→Guide) |
||
| Line 68: | Line 68: | ||
== Guide == | == Guide == | ||
| + | |||
=== Infrastructure Viewer === | === Infrastructure Viewer === | ||
| − | The interface is provided at [http://monitor.d4science.research-infrastructures.eu/iv/ Infrastructure Viewer] and a screenshot is shown below. | + | The interface of the tool is directly provided at [http://monitor.d4science.research-infrastructures.eu/iv/ Infrastructure Viewer]. Currently, it is the default tool at which the user is redirected by following the [http://monitor.d4science.research-infrastructures.eu/ Monitoring Webtool] link. and a screenshot is shown below. |
[[Image:Iv-mon.jpeg|frame|center|The Infrastructure Viewer monitoring tool.]] | [[Image:Iv-mon.jpeg|frame|center|The Infrastructure Viewer monitoring tool.]] | ||
| Line 95: | Line 96: | ||
[[Image:Iv-mon-details.jpeg|frame|center|Pop-up window providing full information about a gHN]] | [[Image:Iv-mon-details.jpeg|frame|center|Pop-up window providing full information about a gHN]] | ||
| + | |||
| + | === Live Monitoring === | ||
| + | The Live Monitoring can be found at the [http://monitor.d4science.research-infrastructures.eu/monitoring/ Live Monitoring]. A sample screenshot is shown below. | ||
| + | |||
| + | TODO: screenshot | ||
| + | |||
| + | The [http://monitor.d4science.research-infrastructures.eu/fast-monitoring/ Fast Monitoring], shown in figure bellow, is the default tool where the user is also redirected by following the [http://monitor.d4science.research-infrastructures.eu/ Monitoring Webtool] link. | ||
| + | |||
| + | [[Image:Fast-mon.jpeg|frame|center|A screenshot of the Monitoring System. By default the Fast Monitoring tool appears.]] | ||
| + | |||
| + | The first step is to select a virtual organization (VO) and/or a virtual research environment (VRE) from a the drop-down list at the left hand side corner of the interface, called '''Select VO'''. | ||
| + | |||
| + | The main section is divided into two main panels. The left, organizes D4Science Resources in three manners. | ||
| + | |||
| + | * '''Resource Type''' contains general information about resources (gHN nodes, running instances e.t.c.) registered to the selected VO/VRE. | ||
| + | |||
| + | * '''WS Resource Type''' organizes information according to stateful resources maintained by specific Web Service running instances of a VO/VRE. | ||
| + | |||
| + | * '''Map''' where it binds information about resources to their geographical location. | ||
| + | |||
| + | The right panel, presents details about the selected (from the left panel) resources. The figure above for example, shows the fast monitoring tool presenting the gCube Hosting Nodes (gHNs) registered to the ''d4science'' VO/VRE. Selecting a specific resource from the upper window refreshes the lower one with detailed information about that gHN in an XML-like manner. Similarly, one can gather information about other types of objects like ''Generic Resources'' or ''Running Instances''. The next figure shows the fast monitoring tool, providing geographical information of running services in Athens. | ||
| + | |||
| + | [[Image:Fast-mon-map.jpeg|frame|center|Fast Monitoring enables someone to geographically locate resources.]] | ||
| + | === Advanced Monitoring === | ||
| + | Last but certainly not least of the tools provided for monitoring the d4science infrastructure is the [http://monitor.d4science.research-infrastructures.eu/monitoring/ Advanced Monitoring], shown bellow. | ||
| + | |||
| + | TODO: screenshot | ||
| + | |||
| + | I | ||
Revision as of 10:50, 6 October 2009
![]() THIS SECTION OF GCUBE DOCUMENTATION IS CURRENTLY UNDER UPDATE.
THIS SECTION OF GCUBE DOCUMENTATION IS CURRENTLY UNDER UPDATE.
A D4Science infrastructure manages various types of resources, such as:
- Hardware
- Services and Applications
- Collections and Auxiliary Resources
Hardware resources include gLite storage elements and computing nodes as well as gCube hosting nodes (containers), while gCube services and external software fall into the second category type. Collections and auxiliary resources can be data, metadata, indices, schemas or transformation utilities, among others.
All these resource information are put into gCube Information System (IS) which plays the role of the infrastructure's registry and supports the publishing, discovery and monitoring of all the parts that form the infrastructure. D4Science provides two monitoring tools, namely Fast Monitoring and Infrastructure Viewer, in order to provide quick organization and visualization of the resources and how they are related to each other. The tools are accessible at the Monitoring Webtool.
Contents
Monitor Portal Installation
Once a tomcat instance as been installed the monitor portlet wars have to be putted into the $CATALINA_HOME/webbaps/.
This is the list of monitor portlets war containing the two applications below can be downloaded from here: [| monitoring application WAR(s)]
- Infrastructure Viewer
- Advanced Monitoring
Configuration
Each portlet have a configuration file where the Infrastructures VO are specified.
Configuring Infrastructure Viewer
The configuration file path is {applicationFolder}/XML/scopedata.xml.
The scopedata file have this structure:
<?xml version="1.0" encoding="UTF-8"?>
<infrastructures>
  <infrastructure>
    <name>d4science</name>
    <vos>
      <vo>
        <name>d4science</name>
        <src>ServiceMap_d4science.research-infrastructures.eu.xml</src>
        <scope>/d4science.research-infrastructures.eu</scope>
      </vo>
    </vos>
  </infrastructure>
<infrastructures>
Tags:
- infrastructures: the infrastructures list.
- infrastructure: a single infrastructure.
- name: the infrastructure name (like gcube or d4science)
- vos: the vo list.
- vo: a single vo.
- name: the vo name.
- src: the vo ServiceMap file (located in $GLOBUS_LOCATION/config dir).
- scope: the vo scope.
- vo: a single vo.
- infrastructure: a single infrastructure.
Here a complete sample.
When a new VO is added, a new vo tag is needed. The VRE are discovered automatically.
Configuring Advanced Monitoring
You can refer to the Infrastructure Viewer guide for the setting of the Infrastructure / VO(s). You should also edit another configuration file which is located {applicationFolder}/config/config.properties.
ONLY the default scope property MUST be changed.
Guide
Infrastructure Viewer
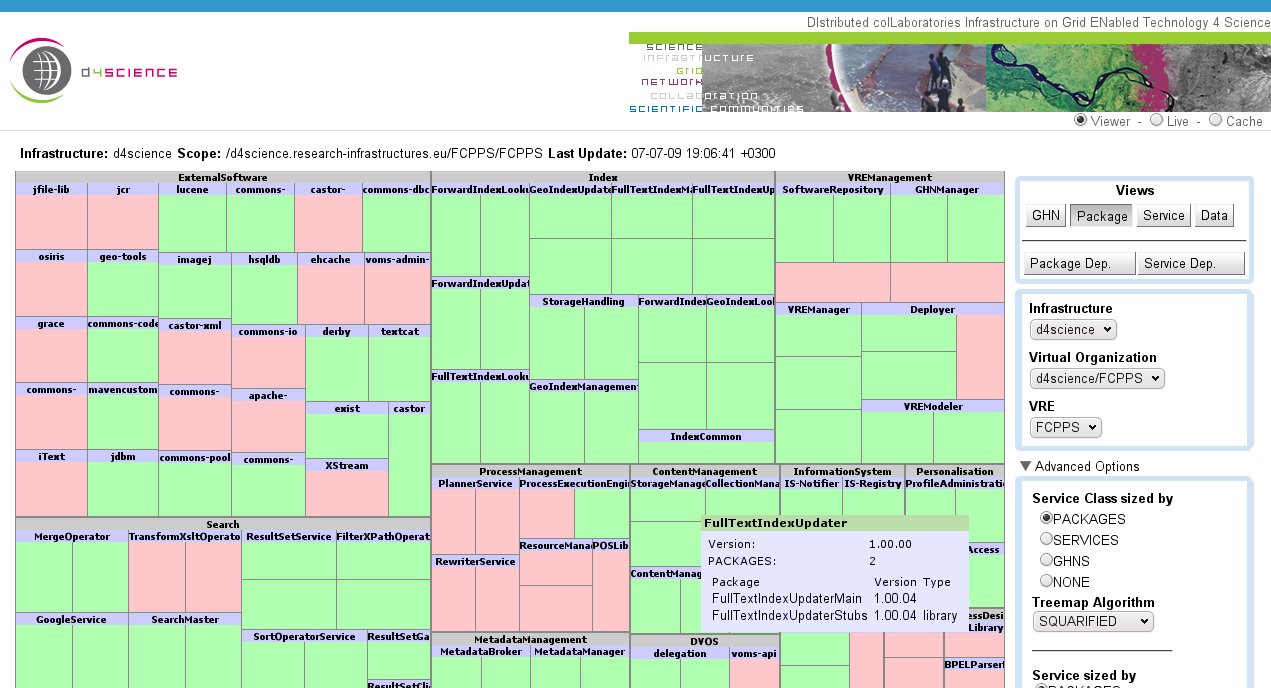
The interface of the tool is directly provided at Infrastructure Viewer. Currently, it is the default tool at which the user is redirected by following the Monitoring Webtool link. and a screenshot is shown below.
This webtool has been designed to provide different views for various purposes. Views can be for
- gHN (Sites, gCube Hosting Nodes, and Running Instances)
- Package (Service Archives, and Software Packages, and gHNs)
- Service (Service Classes, Service Names, and Running Instances)
- Data (Collections, Metadata Collections, and Indices)
- Package Dependencies
- Service Dependencies
Each view can be applied on a specific scope identified by:
- the Infrastructure,
- the Virtual Organization, and
- the Virtual Research Environment.
Additionally, each view provides specific metrics like CPU or disk space for gHNs, indices and meta-data collections for data, e.t.c.
The above figure depicts a spacial view for packages in d4science infrastructure for the FCPPS/FCPPS VO/VRE according to some metrics selected under the Advanced Options drop-down list.
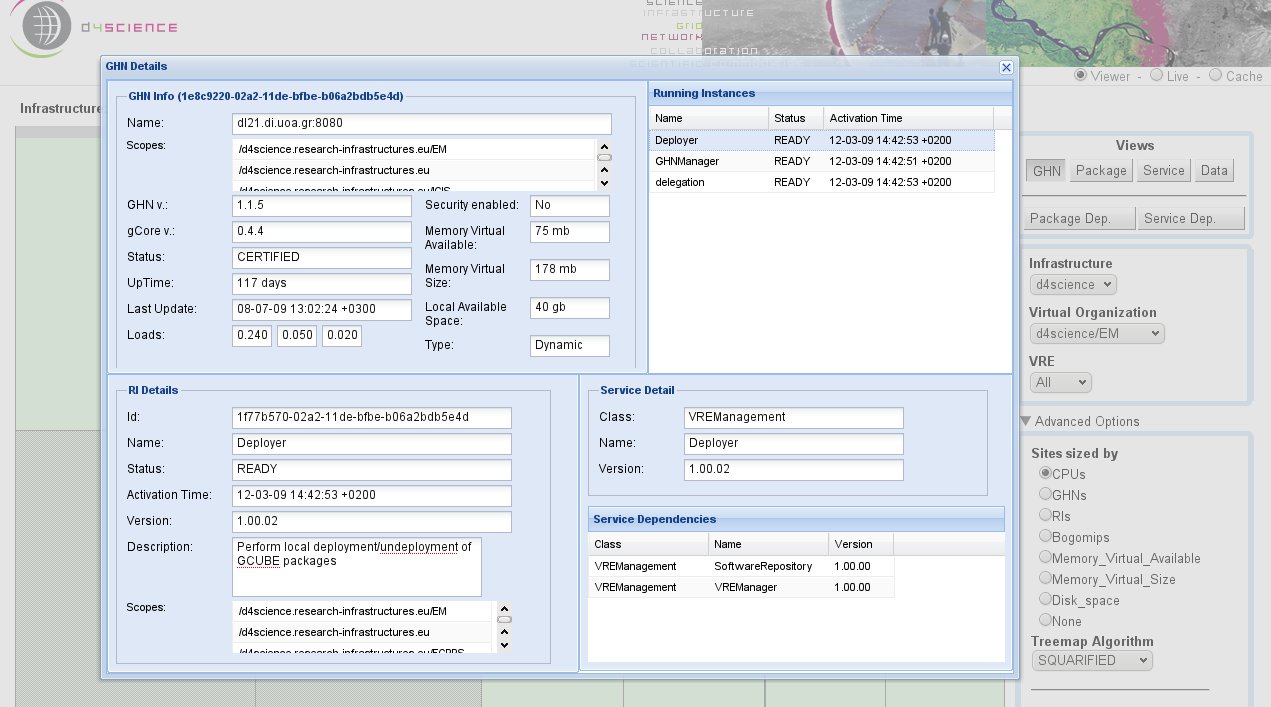
Living the cursor of the mouse above a resource, additional information is provided through a caption area. Additionally, for gHN and Services views, right-clicking on a resource, results in a pop-up window, that organizes full and detailed information, as it is depicted bellow.
Live Monitoring
The Live Monitoring can be found at the Live Monitoring. A sample screenshot is shown below.
TODO: screenshot
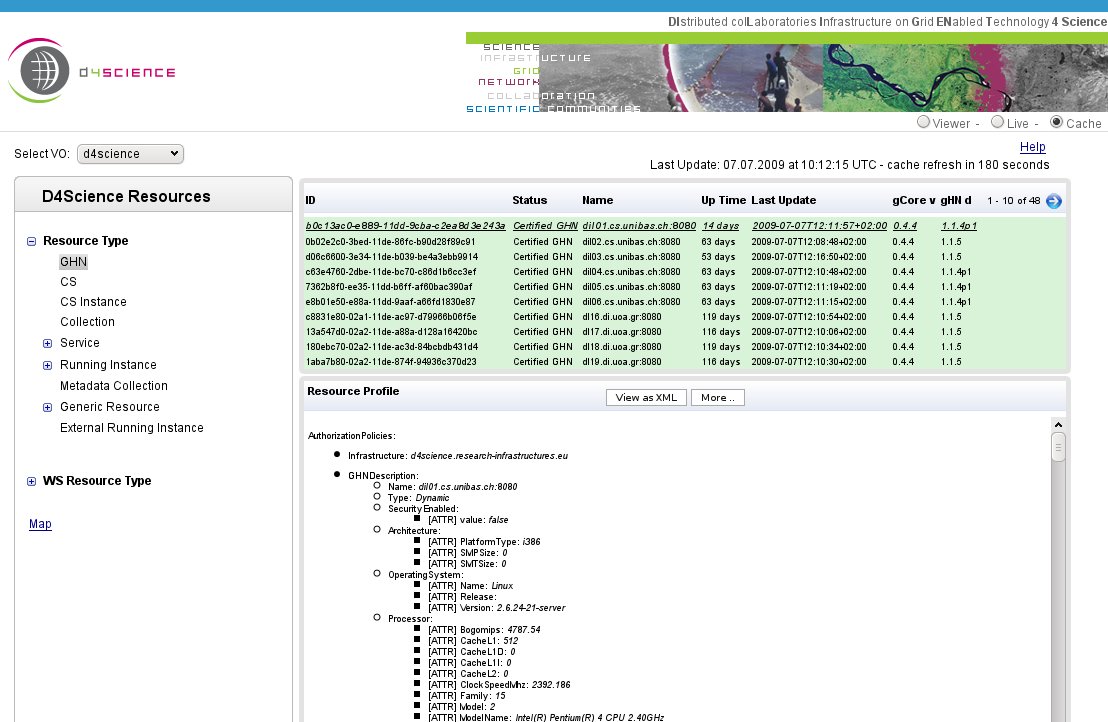
The Fast Monitoring, shown in figure bellow, is the default tool where the user is also redirected by following the Monitoring Webtool link.
The first step is to select a virtual organization (VO) and/or a virtual research environment (VRE) from a the drop-down list at the left hand side corner of the interface, called Select VO.
The main section is divided into two main panels. The left, organizes D4Science Resources in three manners.
- Resource Type contains general information about resources (gHN nodes, running instances e.t.c.) registered to the selected VO/VRE.
- WS Resource Type organizes information according to stateful resources maintained by specific Web Service running instances of a VO/VRE.
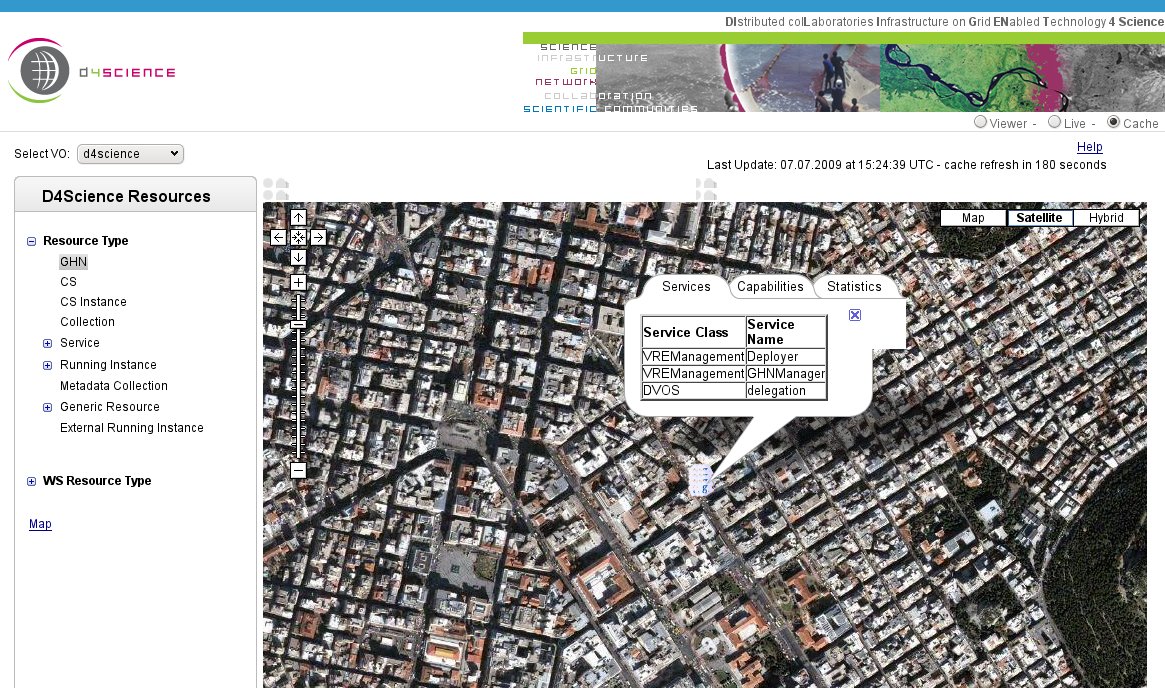
- Map where it binds information about resources to their geographical location.
The right panel, presents details about the selected (from the left panel) resources. The figure above for example, shows the fast monitoring tool presenting the gCube Hosting Nodes (gHNs) registered to the d4science VO/VRE. Selecting a specific resource from the upper window refreshes the lower one with detailed information about that gHN in an XML-like manner. Similarly, one can gather information about other types of objects like Generic Resources or Running Instances. The next figure shows the fast monitoring tool, providing geographical information of running services in Athens.
Advanced Monitoring
Last but certainly not least of the tools provided for monitoring the d4science infrastructure is the Advanced Monitoring, shown bellow.
TODO: screenshot
I


