Difference between revisions of "GeoExplorer"
m |
|||
| (5 intermediate revisions by 2 users not shown) | |||
| Line 1: | Line 1: | ||
| + | [[Category:User's Guide]] | ||
| + | <!-- CATEGORIES --> | ||
| + | [[Category: gCube Spatial Data Infrastructure]] | ||
| + | <!-- CATEGORIES --> | ||
| + | |||
The GeoExplorer Portlet is a web application that allows users to interactive navigate, organize, analyze, search and discovery internal or external '''GIS Layers'''. GeoExplorer Portlet operates on a '''GeoNetwork''' instance in order to discover layers residing on a '''distributed e-Infrastructure'''. | The GeoExplorer Portlet is a web application that allows users to interactive navigate, organize, analyze, search and discovery internal or external '''GIS Layers'''. GeoExplorer Portlet operates on a '''GeoNetwork''' instance in order to discover layers residing on a '''distributed e-Infrastructure'''. | ||
| − | |||
| − | |||
== Overview == | == Overview == | ||
| Line 17: | Line 20: | ||
The webapp is partitioned into two logical components: the '''GeoExplorer''' area and the GisViewer area. | The webapp is partitioned into two logical components: the '''GeoExplorer''' area and the GisViewer area. | ||
| − | |||
| − | |||
| − | |||
| − | |||
| − | |||
| − | |||
| − | |||
== GeoExplorer Component == | == GeoExplorer Component == | ||
[[File:GeoExplorer_screenshot2.jpg|500px|thumb|right|Fig. 1 - GeoExplorer panels subdivision]] | [[File:GeoExplorer_screenshot2.jpg|500px|thumb|right|Fig. 1 - GeoExplorer panels subdivision]] | ||
| − | The GeoExplorer component offers an analytic view of all layers discovered by GeoNetwork. It consists | + | The GeoExplorer component offers an analytic view of all layers discovered by GeoNetwork. It consists of two panels: a tabular paging view of the layers (fig. 1.1), and a layer details contextual panel (fig. 1.2). The table exposes a summary of layers metadata, like the layer title, name and url of the Geoserver that stores this layer. |
It's possible to: | It's possible to: | ||
| − | * | + | * interactively move around the pages; |
| − | * operate | + | * operate filtering and sorting to search for a given layer; |
| − | * select one or more layers to | + | * select one or more layers to be shown in the GisViewer; |
| − | * obtain | + | * obtain on demand details for a selected layer (layer image preview, name, title, full name and so on); |
| − | + | In order to add a layer, a user can click on the AddLayer button [[file:GeoExplorer_Gisplus_Icon.png]] in the table. In order to add several selected layers (by means of checkboxes), a user can click on the "Add Selected Layers" button (located on the top of the table). | |
| − | Note: the layers are loaded by a csw global query on the GeoNetwork server; this query can take some minutes, therefore a cache is used for | + | Note: the layers are loaded by a csw global query on the GeoNetwork server; this query can take some minutes, therefore a cache is used for offering a rapid layers exploration. This cache is updated each 30 minutes, but it's possible to operate an "hard refresh" (by means of the update button [[file:GeoExplorer_HardRefresh.png]] on the top) to force reload. |
| Line 48: | Line 44: | ||
== GisViewer Component == | == GisViewer Component == | ||
| − | [[file:GeoExplorer_screenshot3.jpg|500px|thumb|right|Example of a GisViewer screenshot]] The GisViewer is a widget based on a map container for the layers chosen by user | + | [[file:GeoExplorer_screenshot3.jpg|500px|thumb|right|Example of a GisViewer screenshot]] The GisViewer is a widget based on a map container for the layers chosen by a user with the GeoExplorer. The philosophy of the GisViewer is that each layer can have a spatial representation on a map, and more layers can be overlapped in several ways. |
| − | A graphical map-based representation is crucial for | + | A graphical map-based representation is crucial for enabling users to analyze layers containing geo-spatial data and to retrieve hidden information. Many layer tools have been developed oriented to user-friendly interaction. |
| − | Initially the GisViewer is a collapsed panel located on the top. By adding one ore more layers from the GeoExplorer Panel the Gisviewer Panel automatically | + | Initially the GisViewer is a collapsed panel located on the top. By adding one ore more layers from the GeoExplorer Panel, the Gisviewer Panel automatically expands to show opened layers. However it's possible at any time to expand or collapse the panel by means of the Expand/Collapse button [[file:GeoExplorer_OpenButton.png]]. Also the panel can be horizontally resized by the horizontal line between GeoExplorer and GisViewer Panels. |
| − | The GisViewer panel consists | + | The GisViewer panel consists of three sub-panels: '''Layers Panel''', '''Map Panel''' and '''Data Panel'''. |
===Layers Panel=== | ===Layers Panel=== | ||
| − | The Layers panel (fig. 2) is the container for all layers that users want to analyze | + | The Layers panel (fig. 2) is the container for all the layers that users want to analyze. This panel uses the "overlay" concept to enable users to create a personal view map environment. The layers are represented by a dynamic sortable list, where the sorting denotes how the layers are overlapped and how they are shown on the map. Again, the layers can be selectively hidden/shown to smartly focus on a different layers subset. |
| − | Each layer | + | Each layer presents an integrated toolbar which allows different operations. This toolbar can be separately opened for each layer, in order to have more flexibility (fig. 3). |
| − | From the layer tools it's possible to | + | From the layer tools it's possible to: |
| − | * | + | * Set layers opacity; |
| − | * | + | * Select an alternative layer style, if exists (fig. 4); |
| − | * | + | * Perform a CQL filter (fig. 5); |
| − | * | + | * Save a layer snapshot into the workspace or save on the local file system (fig. 6); |
* Get a transect function on the layer by specifying a line on the map (fig. 7) | * Get a transect function on the layer by specifying a line on the map (fig. 7) | ||
| − | |||
| − | |||
| − | |||
===Map Panel=== | ===Map Panel=== | ||
| − | The Map Panel | + | The Map Panel shows a GIS navigable map of all visible layers, exploiting the OpenLayers javascript library. It's possible to pan and zoom on the map allowing users to find geographic information. |
| − | Furthermore, a pop-up panel is included on | + | Furthermore, a pop-up panel is included on the right side of the map for base layers selection. Typically a base layer is a map such as "True Marble" or "GEBCO" which is useful as reference for all visible layers (fig. 8). |
===Data Panel=== | ===Data Panel=== | ||
| − | The Data Panel is used to get tabular spatial data related to one or more | + | The Data Panel is used to get tabular spatial data related to one or more layers on a defined geographical area. By default this panel is collapsed and it is shown when a spatial query is made, but it can be expanded or collapsed at any time. |
| − | From the Map Panel users can operate a spatial query to get visible layers information around a point on the map or a rectangular area. | + | From the Map Panel users can operate a spatial query to get visible layers information around a point on the map or a rectangular area. By simply clicking or drawing a rectangle on the map the query starts. The Data Panel will eventually show all available data for this spatial selection (there will be a table for each visible layer). It's also possible to export a csv data file for external analysis. |
Latest revision as of 13:00, 6 July 2016
The GeoExplorer Portlet is a web application that allows users to interactive navigate, organize, analyze, search and discovery internal or external GIS Layers. GeoExplorer Portlet operates on a GeoNetwork instance in order to discover layers residing on a distributed e-Infrastructure.
Contents
Overview

The GeoExplorer Portlet provides the following facilities:
- Internal layers exploration (preview, sorting, filtering, multi-selecion);
- Interactive layers visualization on a Geospatial Map (zoom & pan);
- Visual correlation analysis of several overlying layers;
- CQL visual filter of one or more layers;
- Tabular spatial data retrieval of one or more layers;
- Transect layers analysis;
- Default Base Layers visualization (TrueMarble, GEBCO, relief, and so on);
- External WMS Layers management;
The webapp is partitioned into two logical components: the GeoExplorer area and the GisViewer area.
GeoExplorer Component

The GeoExplorer component offers an analytic view of all layers discovered by GeoNetwork. It consists of two panels: a tabular paging view of the layers (fig. 1.1), and a layer details contextual panel (fig. 1.2). The table exposes a summary of layers metadata, like the layer title, name and url of the Geoserver that stores this layer.
It's possible to:
- interactively move around the pages;
- operate filtering and sorting to search for a given layer;
- select one or more layers to be shown in the GisViewer;
- obtain on demand details for a selected layer (layer image preview, name, title, full name and so on);
In order to add a layer, a user can click on the AddLayer button ![]() in the table. In order to add several selected layers (by means of checkboxes), a user can click on the "Add Selected Layers" button (located on the top of the table).
in the table. In order to add several selected layers (by means of checkboxes), a user can click on the "Add Selected Layers" button (located on the top of the table).
Note: the layers are loaded by a csw global query on the GeoNetwork server; this query can take some minutes, therefore a cache is used for offering a rapid layers exploration. This cache is updated each 30 minutes, but it's possible to operate an "hard refresh" (by means of the update button ![]() on the top) to force reload.
on the top) to force reload.
GisViewer Component
The GisViewer is a widget based on a map container for the layers chosen by a user with the GeoExplorer. The philosophy of the GisViewer is that each layer can have a spatial representation on a map, and more layers can be overlapped in several ways.
A graphical map-based representation is crucial for enabling users to analyze layers containing geo-spatial data and to retrieve hidden information. Many layer tools have been developed oriented to user-friendly interaction.
Initially the GisViewer is a collapsed panel located on the top. By adding one ore more layers from the GeoExplorer Panel, the Gisviewer Panel automatically expands to show opened layers. However it's possible at any time to expand or collapse the panel by means of the Expand/Collapse button ![]() . Also the panel can be horizontally resized by the horizontal line between GeoExplorer and GisViewer Panels.
. Also the panel can be horizontally resized by the horizontal line between GeoExplorer and GisViewer Panels.
The GisViewer panel consists of three sub-panels: Layers Panel, Map Panel and Data Panel.
Layers Panel
The Layers panel (fig. 2) is the container for all the layers that users want to analyze. This panel uses the "overlay" concept to enable users to create a personal view map environment. The layers are represented by a dynamic sortable list, where the sorting denotes how the layers are overlapped and how they are shown on the map. Again, the layers can be selectively hidden/shown to smartly focus on a different layers subset.
Each layer presents an integrated toolbar which allows different operations. This toolbar can be separately opened for each layer, in order to have more flexibility (fig. 3).
From the layer tools it's possible to:
- Set layers opacity;
- Select an alternative layer style, if exists (fig. 4);
- Perform a CQL filter (fig. 5);
- Save a layer snapshot into the workspace or save on the local file system (fig. 6);
- Get a transect function on the layer by specifying a line on the map (fig. 7)
Map Panel
The Map Panel shows a GIS navigable map of all visible layers, exploiting the OpenLayers javascript library. It's possible to pan and zoom on the map allowing users to find geographic information.
Furthermore, a pop-up panel is included on the right side of the map for base layers selection. Typically a base layer is a map such as "True Marble" or "GEBCO" which is useful as reference for all visible layers (fig. 8).
Data Panel
The Data Panel is used to get tabular spatial data related to one or more layers on a defined geographical area. By default this panel is collapsed and it is shown when a spatial query is made, but it can be expanded or collapsed at any time.
From the Map Panel users can operate a spatial query to get visible layers information around a point on the map or a rectangular area. By simply clicking or drawing a rectangle on the map the query starts. The Data Panel will eventually show all available data for this spatial selection (there will be a table for each visible layer). It's also possible to export a csv data file for external analysis.

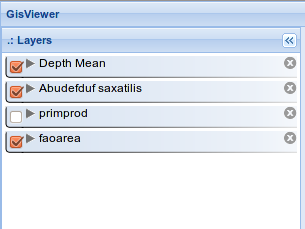
Fig. 2 - Layers Panel
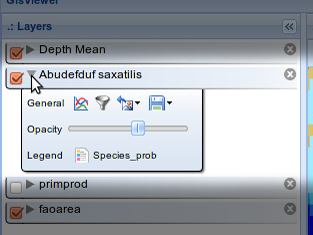
Fig. 3 - Layer Tools
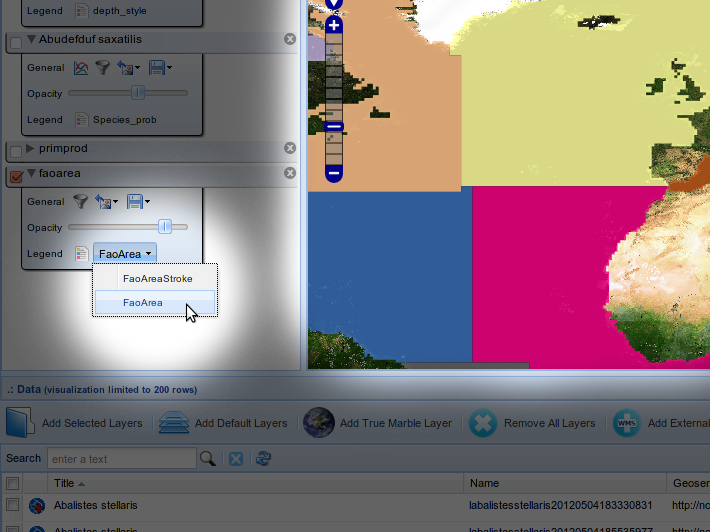
Fig. 4 - Layer styles selection
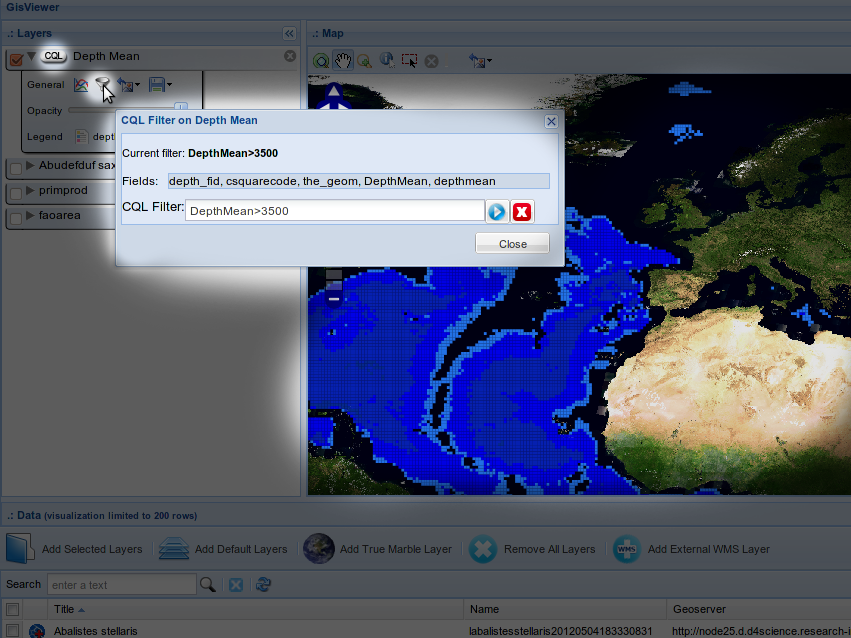
Fig. 5 - Example of CQL filter on depth mean
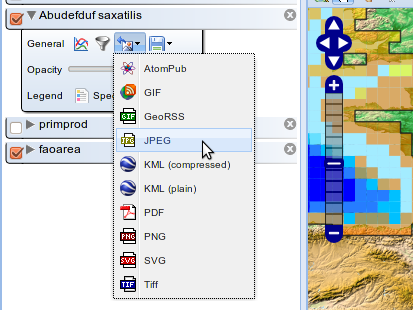
Fig. 6 - Layers Panel
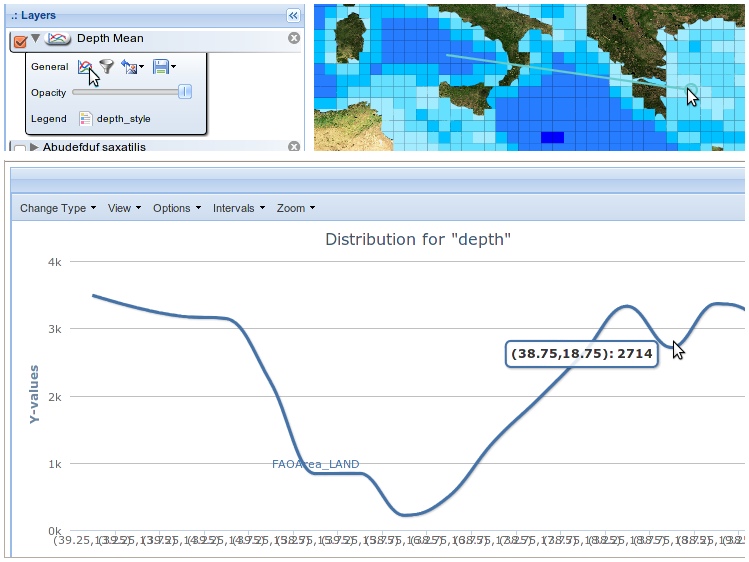
Fig. 7 - Layer transect operation


