Common Functionality
Contents
Login to VRE
Once you have signed in to the portal, you can see the User interface where you can select a VRE to work on. In the drop down list on the right of the page you can choose any of the available VREs and load it.
In the following figure you can see the interface. After the login select the preferred VRE to load and click "enter"
Search
Search is the most important functionality in the gCube system.
You can perform different kind of searches, depending on the results you want to have and how generic or specific your search wants to be. The different kinds are: Combined Search, Simple Search, Quick Search, Google Search, Collection browsing, Generic Search and Search in previous results. Each one of them will be described below.
In order to perform a Combined Search, a Simple Search, or a Collections Browsing, you first have to select collections. For this purpose you have to use the Select Collections portlet.
Independently of the search type all results are displayed by the Results portlet.
Select Collections
By using this portlet, you can select the desired collections in order to browse or search them.
The collections are presented in a tree hierarchy. The first level of nodes represents a collection group and each group contains several collections. In the following image, f.i. Time Series Graphs is a collection group. On the left of each checkbox, there is either a close folder icon or an opened folder icon. If there is a closed folder icon, it means that there are other collections inside this group of collections. By click on it, you can see the underlying collections. On the other hand, if there is an opened folder icon, it means that the node is expaned and you already see the inner collections (like Maps). So, if you click on it, you can hide them.
In order to select/deselect a collection, you have to click on its name or checkbox. Additionally, you can select a group of collections simply by selecting the group of collections they belong to. As you can see below, if you select the Maps collection group, then all the collections that belong to this group are selected.

A full description for each collection is available, if you click on (more) link. A pop up window appears containing a description of the corresponding collection as you can see bellow. Under the name of each collection you can also see a part or the full description for each collection.

For your flexibility you can search through the available collections for a keyword that may be included in collections name and/or description. The following image displays this functionality.

The collections that you have already selected, are also selected at the pop-up window with the search results. You can deselect the already selected collections or select new collections. By clicking on the results at the pop-up window this change will also be applied at the collections tree.
Combined Search
In Combined Search you have to select the collections you want to search in at the left panel, by performing some of the actions described above. Then in the right panel you select the Combined Search header and you can type as many keywords as you like. You can select the fields where each one of the keywords should exist in. Depending on the common schema of the selected collections and the indexes that the back-end supports there are choices like title, language, creator, description and 'Terms' (which means that you want to search for this keyword everywhere inside the selected collections).

Different metadata schemata may be available for the selected collections. You can change the metadata schema, and the language if the same metadata schema is available in different languages. This choice affects the fields you can search through and the ones you can specify for sorting the results.

You can add a new condition by pressing the Add Condition (+) button. If you have more than one condition, you can select whether you want to search for results matching all conditions or for results matching any condition. You can do this by selecting one of the below radio buttons. The default choice is: match any condition. You can also specify by which field you want the results to be sorted and by which order. If you don't specify anything the results are not sorted

You can delete any of the conditions by pressing the "-" button or you can clean the whole form by pressing the Reset button. Notice here that if there is only one condition and try to delete it a warning message will appear and the condition will not be deleted.
Simple Search
In Simple search you can search for the keywords you type at the text area, in the collections you have selected on the left panel.
When you use the simple search, a full text search is performed, which means that the keywords you have typed are being searched inside all fields of the selected collections.
You can also change the metadata schema that will be used for this search by choosing on of the available schemata from the drop down list.

Please notice here, that there could be a case that you won't be able to perform a simple search if you select a schema that does not support full text search. In that case a message will appear informing you about this case.

Collection Browsing
In Collection Browsing search you have two options. You can browse all the contents of the collection you have selected on the left panel or you can perform a distinct browse on the selected field. You can choose by which element the results will be sorted and by which order. The browsing can be used only if you have selected one collection. You cannot browse multiple selected collections at the same time.

You can also specify how many results will be shown per page at the results portlet. Notice here that the default value is 10 results per page and that you cannot request more than 50 results per page.
In the text box only digits are allowed and if you type a number greater that 50 an alert will appear to inform you about the allowed values.

You can click on the information buttons so that you will be informed about the result of each different type of browse.
Search in Previous Results
Using this portlet you can refine your search results of the last queries you had performed using either the combined or the simple search. First you should select which of the last results you want to refine, then you can type the keywords you want to search for and click the search button. Notice here that the refinement of a previous query is not affected by the current selected collections. The keywords you search for are applied to the results you want to refine.

By clicking on the see query link you can see the query you want to refine written on the gCube's query language.

After the selection of the query you have two options: you can either browse the results of this query by clicking on the see results link, or you can refine these results by adding new conditions and clicking the Search button.
Submit queries saved in basket
In the search portlet you can select to submit queries that you have saved in your basket. Click on the basket icon, select the query you want to submit and click OK.

After selecting the query you can either submit this query or you can choose a new query using the same way.

Quick and Google Search
Using Quick Search you can perform a generic search in the gCube system. No selection of collections is required in order to search using this feature. The system automatically identifies the most appropriate collections to search, taking into account the terms specified by the user. You can also perform a Google search, whose results are displayed in the Results portlet. Due to google's restrictions the system returns at most 10 results

Generic Search
Generic Search allows you to type a query in the gCube query language. In order to submit a valid query, you must be well aware of both the syntax of the query and the current status of the infrastructure. You must know the IDs of the content and also the existence or not of several types of indexes. For this reason you are provided with all these information.
After you submit the query you should go to the results page in order to browse the results.

Information about the syntax of the query language can be found here
Geospatial Search
For geospatial indexed collections it is possible to use the map located in the center of the page to specify a geographical area to search in.
The Pan Tool situated above the map is the default tool selected to allow the user to drag the map, and to zoom in by double clicking on it.
There are different ways to define the area; a user can define the area:
by selecting the Country / Zone from the dropdown list placed on the top of the map. The list contains many countries all across the world as well as continents and relevant world zones.

by clicking on the rectangular selection tool (in orange on the figure below), thus activating the rectangular selection tool.
Once the button is pressed, first click on the map to set the starting point, then move the mouse on the map, second click to close the select operation. The tool will automatically zoom the selected area.

by clicking on the polygonal selection tool (in orange on the figure below), thus activating the polygonal selection tool.
Once the button is pressed, first click on the map to set the starting point, then move the mouse on the map, each click after the first will specify the next vertex to add at the polygon. Double click to close the select operation. The tool will automatically zoom the selected area.

Below the map there are some optional parameters you can also add for enriching your query.
The geo-coordinates of the selected area are automatically updated depending on the user selection. You can also specify geo-coordinates yourself by entering the values in the textboxes and clickink apply. Clicking on the calendar icon will cause the date picker opening.

Result Browsing
This portlets aims to provide with common navigational functionality through the results. In addition a set of action can be performed on each result record, like accessing metadata, add annotations, saving or viewing the content, etc.
Common Browsing Activities
You can navigate throughout the results by using the arrows: previous and next.
For each result, you can see a set of information, retrieved from object's metadata. The record's presentation form is user configurable. You can select the prefered layout for results, by using the User Profile Editing portlet.
Each D4Science Information Object may have [Metadata], Alternative representations, Parts and [Annotations]
If they exist, a further tab is shown next to the Tab Object.

When Metadata, Alternative, Parts or Annotation tab is clicked an additional request is sent to the system in order to retrieve additional information. Once the request is complete it is possible to click on the retrieved information; a pop-up will be shown for visualizing the information to the user.

In the case of Figure 2 the system shows that two metadata are associated to the result object, adding the Metadata Schema and Language for both of them. If the user clicks on one of the associated metadata a popup windows is shown displaying the metadata in both HTML Formatted and XML Formatted (as shown in the figure below)


Moreover, you can perform a set actions on each result by clicking on the D4Science Eye (The Icon on the right):
- View Content: Opens a popup window that contains, and displays the content.
- Save Content: Forces browser to ask to save the content in you local disk.
- Manage Annotations: You can add /remove / edit annotations for this object.
- View Metadata: You can view record's metadata in the metadata portlet.
Move page results to basket and Move query to the basket features
Moreover once you get results it is also possible to use Move all the page results to the basket, to move the performed query to the basket. The correspondent bottons are shown in the figure below:

The Basket
The Basket is thought of as a personal user area, dependent on which VRE is used . The user can save its own preferred results by dragging them on it.
Drag operations can be performed by using the move cross next to each text, highlighted with the red circle in the figure below.

It is also possible to drag a metadata, an alternative representation, a part or annotation (if any) associated to a result.

Once you have chosen your results you have the possibility to make them persistent by clicking the save button on the header. The basket will be saved in your workspace.
Annotations
Annotations’ management is performed by the Annotation Portlet. This is a graphical user interface which provides an easy and sufficient way to annotate gCube information objects. Annotation Portlet can be invoked by selecting the “Manage Annotations” action among the actions associated with any item displayed in the Results portlet.
Then the user is moved to the generic annotation portlet where s/he is able to see the title, the mimetype, the content of the selected object as well as its generic annotations sorted by their creation date.
Depending on the mimetype of the annotated object, the visualization of its content may differ.
In most cases, the content is displayed in a specified part of the portlet.
For a zip file, its entries are displayed and the user is able to download any of them.
Tiff images are transformed into a displayable format (png); video files are available only for download and the visualization of pdf files depends on the behavior of the browser (normally a plug-in is required).
On the other hand, the annotations are shown up as a list where their title, their creation/ modification date and the author’s name are posted up. The user is able to select which annotations (comments or associations) s/he wants to see just by clicking on the available checkboxes. The content of the annotations is shown below this list. In the case of associations, the title of the associated object as well as a link to its content is displayed.
The user may perform three operations. He can add an annotation by clicking on the “Add Annotation” button and afterwards by filling in the title and text field, in the case of text annotations, or by filling in the title field and selecting an object existing in the basket as an associated object in the case of associations. S/he may also delete or edit an annotation.
All the changes made by the user are persisted when s/he presses the Apply Changes button.
If anchored annotations are supported for the annotated object the user can choose to be moved to the appropriate portlet by clicking on the “Go to anchored mode” button. Three portlets for anchored annotations are provided, namely, cover images, text and video documents.

In image annotation portlet a user is able to add an annotation to a specific part of the image file. The user selects a space fragment which can be a rectangular area or a specific point (with a pin) and then he fills in the title and text fields. Then the space fragments are shown on the image and by clicking on one of them the content of the annotation is displayed.

In text annotation portlet there is the capability of adding an annotation on a selected text fragment of the textual document (e.g. plain text, xml documents). The selection of the text fragment is done in a very user friendly way as the user has only to choose the part of the text document with his mouse. The text fragments are shown with a different background in order to be distinguishable and by clicking on one of them the content of the annotation is displayed.
In video annotation portlet (still under construction) a user will be able to select a time fragment which means a part of the video file that is defined by its starting and ending moment. Video annotation portlet has although some requirements as it needs Java Media Framework installed on the user’s computer.
Metadata Management
View and Edit metadata are the two functionalities that gCube offers to its users concerning the Metadata Management. These are described below.
Metadata Viewing
The Metadata Viewing Portlet is a graphical user interface that displays the metadata which are associated with a specific information object. This interface displays the object’s metadata in a graphical way which depends on their schema.
Furthermore the portlet provides each user with the ability to change the way the metadata are displayed. If a user wants to manage the layout of the metadata viewing portlet, s/he may choose one layout of the available. This selection can be done in the user profile editing portlet.

Metadata Editing
Metadata’s editing is performed by Metadata Editing Portlet. This is a graphical user interface which can be invoked by selecting to edit the metadata of an object in Results portlet. Depending on the schema of the metadata different editors can be displayed. There are two visual editors for dc and eiDB schemas and a generic one for the rest. However, for some collections, it is forbidden to change the metadata, something that is stated on screen with a relevant message.
The visual metadata editors provide an easy and user friendly way of editing the metadata. Adding, deleting and editing elements can be performed by clicking on the appropriate buttons and filling in text fields. When the desired changes are completed, the user has to apply the changes he has done by clicking on the “Save Changes” button.

The generic editor provides two options. The first one is to edit the bare xml in a text editor and the second one is to upload an xml file as metadata. However, these options require the user to have sufficient knowledge of XML.
User Profile Management
The User Profile Management in gCube provides the functionality to the end-user to view and/or edit his/her profile.
User Profile Editing
The User Profile Editing portlet can be accessed by all users that have a portal account. Each user has his/her own profile and he/she can view and/or edit its content through this portlet. By editing the profile's contents you have several options that affect the search results or the presentation of the results and their metadata.
- Personalize the search results:
- Change the language using the drop-down list. The language in the profile affects the results that will be retrieved. The results will be only contain content in the preferred language.
- EngineType: InternalEngine
EngineType element specifies the desired type of the engine that will be employed for executing plans produced by the search engine. The value type of this element is string. Currently these types are supported:
  InternalEngine: Search internal execution engine
  ActiveBPEL: ActiveBPEL engine
  OSIRIS: OSIRIS execution engine
- Persistence: false
Persistence refers to the ability of the execution engine to persist its runtime state, in order to perform execution reincarnation, multiple executions, execution logging and analysis, etc. The value type of this element is boolean (true or false).
- FaultTolerance: false
FaultTolerance refers to
the ability of the execution engine to recover from errors. The value
type of this element is boolean (true or false).
- Personalize the presentation of the results and their metadata:
- For each available metadata schema you can select one of the available xslts that will be used for the presentation of the results from the results portlet. If you don't change anything the default XSLT will be used.
- For each available metadata schema you can select one of the available xslts that will be used for the presentation of the metadata from the metadata portlet. If you don't change anything the default XSLT will be used.
In order to apply the changes the user has to press the Save profile button. A message is displayed to inform you if the profile was successfully updated.

Report Management
D4Science Reporting allows users to create Report Templates and generate different manifestation of it (OpenXML (.docx), HTML) based on retrieved results. D4Science template definition is made up of two phases:
- 1st Phase:
- You can use the Template Creator Portlet to create a D4Science template, which is partially filled out by static information i.e. static images, static text and so on) and by dynamic ones (i.e. dropping image areas). The Template Creator Portlet produces a D4Science Template that can be loaded into the Report Portlet.
The aim of creating D4Science Templates is the one of creating a basic document structure that can be used lately by actually filling the dynamic parts of the template.
- 2nd Phase
- The Report Portlet is the one that generates one or more instances of templates (built in the 1st phase) allowing the end user to add dynamic content. The instance can be successively exported into the final Report as OpenXML (WORD 2007 DOCX), HTML.
The difference between a template and a report is as follows:
- a template is a way to characterize a class of reports, i.e. identify its structure and its potential constituents;
- a report is obtained by instancing a specific template, i.e. identify the actual pieces of a report.
You can access Reporting by clicking on the tab "Reporting" once a VRE is loaded.
Template Creation
The potential constituents of a template (the ones currently supported) are:
- structured and styled text area, you can define different text areas which then go to compose the template structure:
- Title
- Headings (Level 1, 2, 3)
- Simple Text (Body)
- Images
- Sections
- Table of Contents (TOC)
- Page Breaks
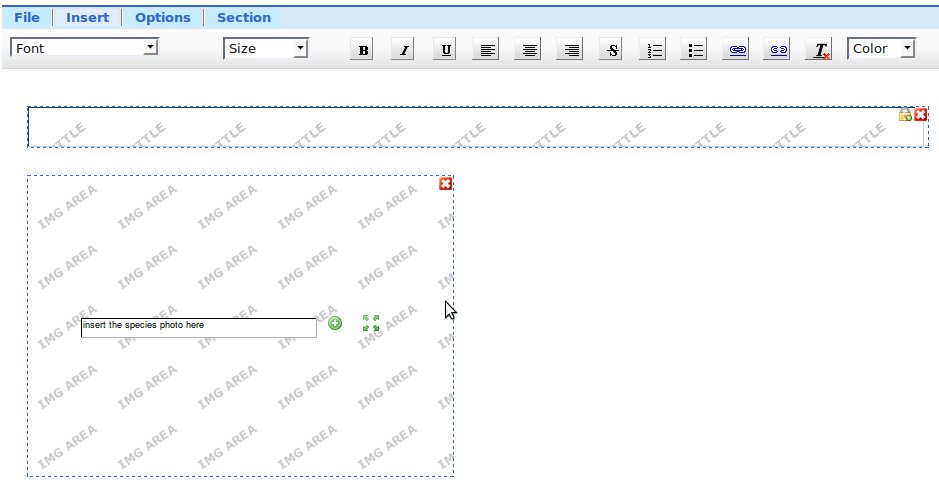
In the Image below you can see a Structured Template Sample
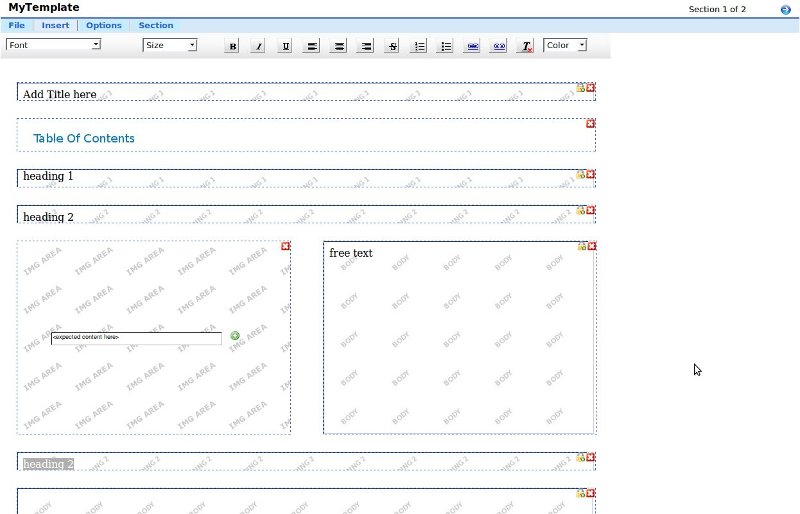

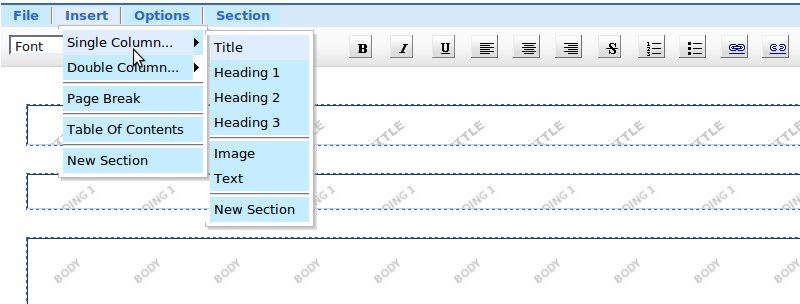
To Insert a template constituent the Insert option in the Menu Bar has to be used.
It is possible to use the single column layout or a double column layout for placing template constituents in the template.
When inserted a structured and styled text area it is possible to use the rich text toolbar situated the top for applying basic text formatting.

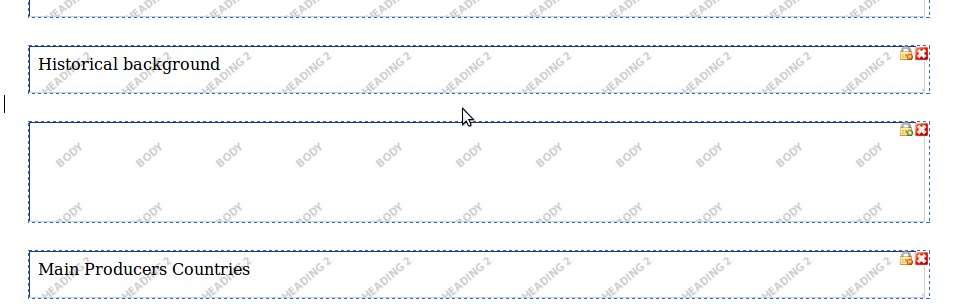
Template constituents (e.g. text, image) are added using top to bottom order if not specified by the user.
To define a new insertion point for a new Template constituent just click in the space gap between two template constituents, a prompt will appear on the left of the section, then you can either go to Insert menu, or click enter to choose the constituent you want to add.
The picture below shows a newly defined insertion point:

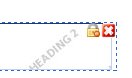
Each Template constituent is equipped with a red x icon in its top-right corner. It allows the user to remove it form the section. Each Text constituent is resizable as you type and is also equipped with a lock icon. If clicked the lock color become red. This will make this area not editable once the template is open in the report portlet.

When inserting an Image area it is possible to specify in the texbox situated in the center a text hint for in it which could act as a suggestion when the template is loaded in the report portlet fot he user which had to fill the report. You can also
- resize the image area by clicking on the four arrows icon placed in the center of the image area.
- set the area as static image. To do so just click on the "plus" green icon and upload one image from your desktop.

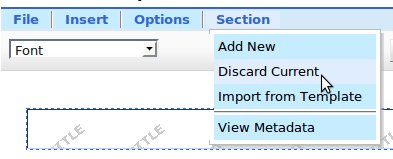
- It is possible to insert new Sections by clicking on the top bar menu Section > Add New or menu Insert > New Section:
A Section is a way to group a set of template components, Sections can be added, discarded and imported. To operate with sections click on the menu item Section

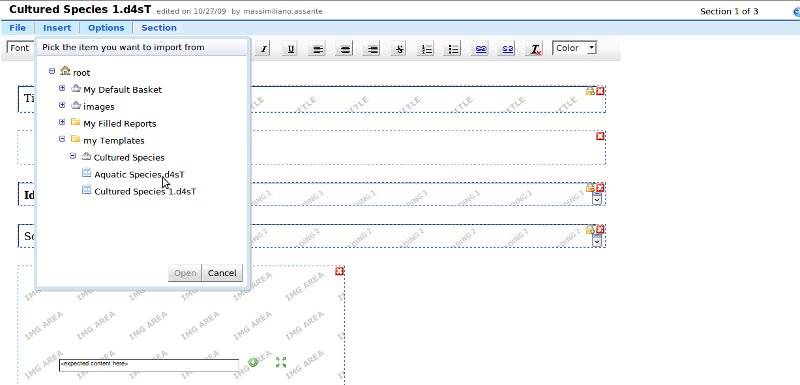
To Import a Section belonging to a different template into the current one, click on the menu Section > Import from template, the user workspace tree is open, pick the template you want to import from as shown in the picture below:

The selected template will be imported, and the Import Template Section Dialog will appear as shown below:
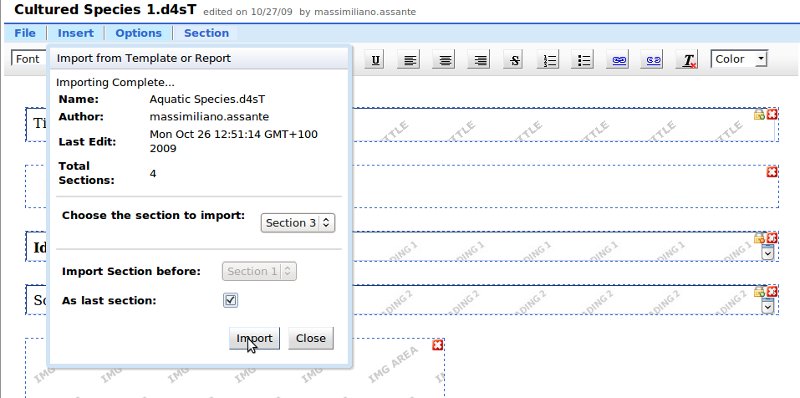

Choose which section import and in where to import in the current template, then click on the import button, the newly added section will be shown on the screen.
- The file menu allows to Save the template, Rename them (Save As), or open a previously saved template.
Report Generation
The Report Portlet is used to generate one or more instances of templates (built iwith the template creator portlet) allowing the end user to add dynamic content. The instance can be successively exported into the final Report as OpenXML (Word docx) or HTML.
On the left of the portlet the user have a Tree which is the same of the Workspace Portlet Tree.
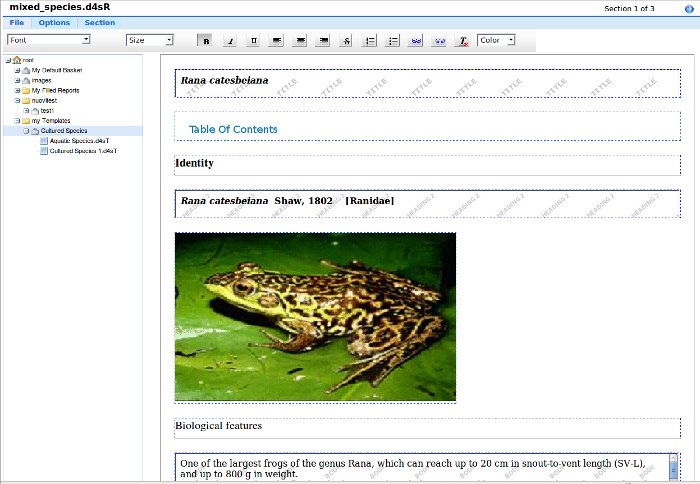
In the picture below you can see a filled report sample:

- The Report portlet can either open Templates (generated by the template portlet) or previously saved reports.
- The List of your templates or reports can be accessed by clicking the menu File.
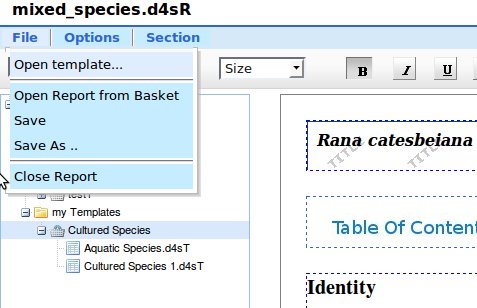

Note that Templates and Report are saved in you workspace area, consequently to either open templates or reports the uses has to choose it's location you the workspace tree which is opened by the system.

Once the template is loaded the user can drag images into the dropping image area from within the baskets.

It is possible to generate a OpenXML, HTML Manifestation of the current open report by using the Options Menu as shown in the figure below.
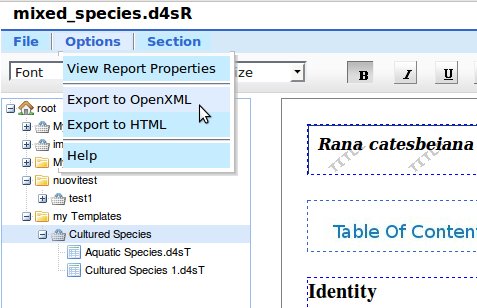

Note that the exported Manifestation process can take up to 5 seconds, once the process has been completed a popup is shown which confirms the success of operation. Note that the exported Manifestation is saved in your workspace, in your default basket.

Importing Template or Report Sections works the same way explained in the template part. Report can be saved.
Course Management
D4Science