Accounting Portlet
Contents
Introduction
This portlet allows the users of the infrastructure to view the accounting information (based on the resources consumption and collected by the storage and services) both in a graph form (aggregated data).
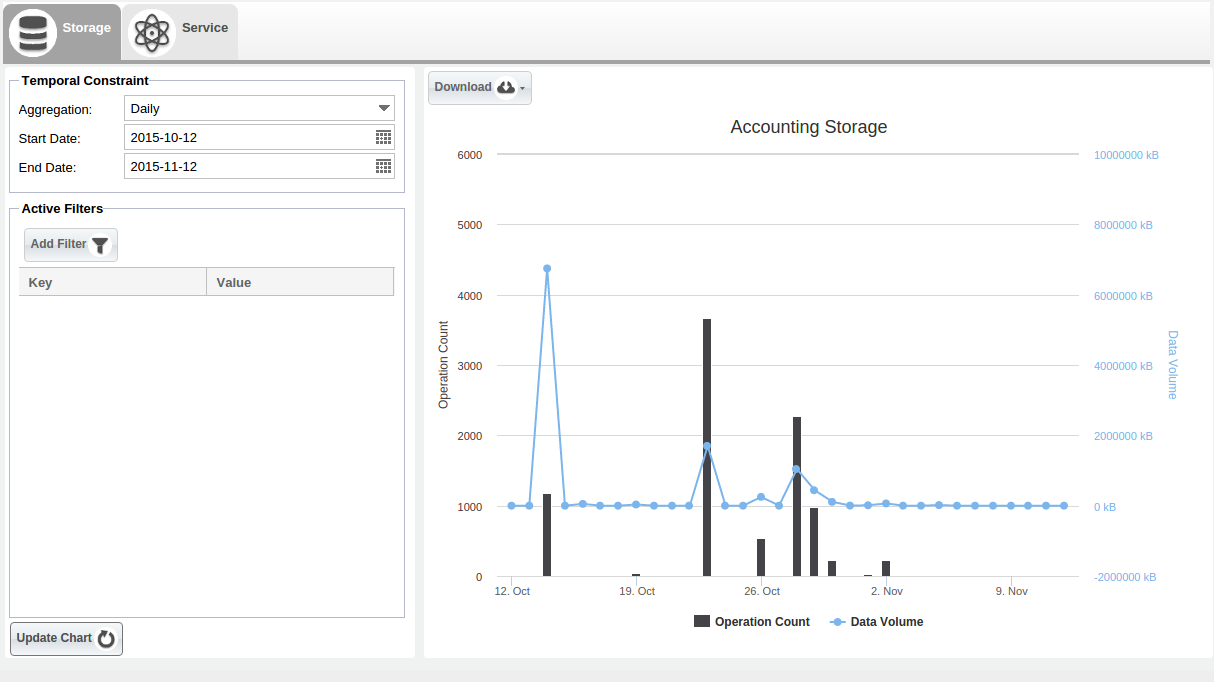
Below is shown the overall layout of the Accounting Manager:
Graph
The purpose of the portlet is to have the views and the data customized by the user roles and the scopes, avoiding to present all accounting records as the first glance and showing some graphs by resource type. For each graph there are filter and time aggregation options.
Following a complete description of these graphs:
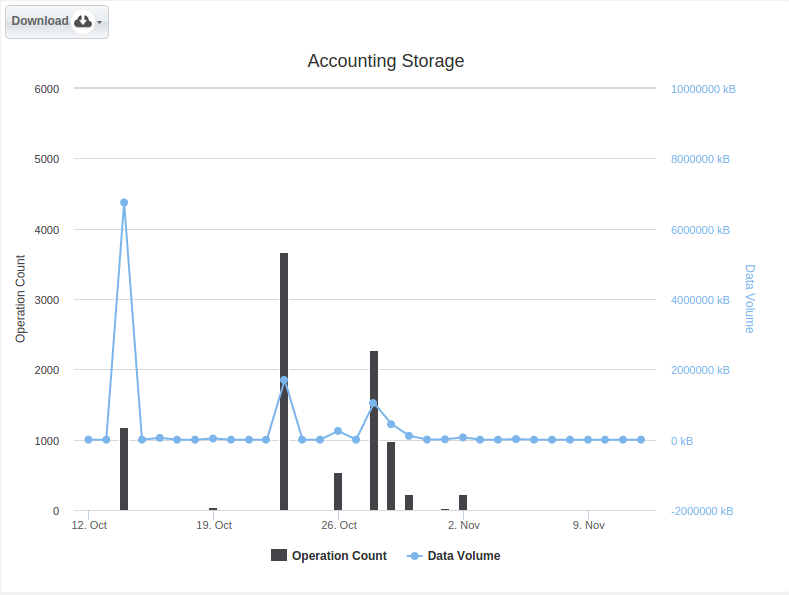
Storage
- Operation Count : represents the count value.
- Data Volume : represents the data volume value.
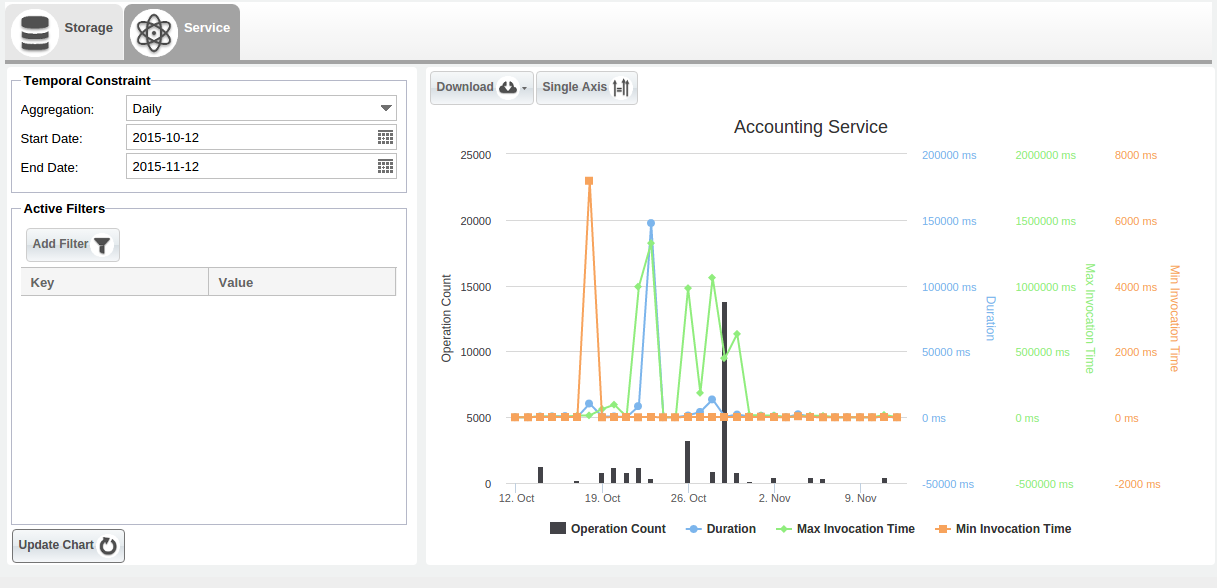
Service
- Operation Count : represents the number of operations.
- Duration Time : represents the duration time of operations.
- Max Invocation Time : represents the max invocations time of operations.
- Min Invocation Time : represents the mix invocations time of operations.
Below is shown an example of the available graph for the Service resource type:
Graph Section
This is the main section of the portlet. A user can select different zoom options, slide the graph moving the cursor at the bottom or dragging the graph. Each axis can be selected and possibly excluded.
Temporal Constraint
This section allows the user to select a time range of interest for the accounting chars. The default value is the last month.
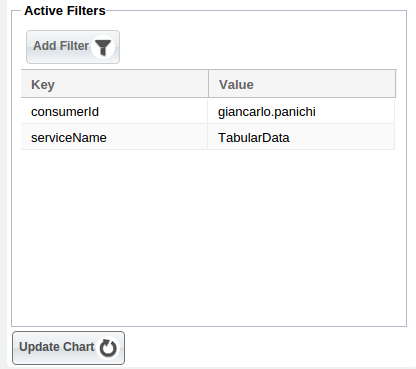
Filters
Each graph data can be filtered. Each resource type has a contextual section of filters. The following menu allows users to select values of these filters clicking the related Add Filter button.


