HTTPS performance tests
Contents
Performance tests on HTTPS infrastructure
Performance tests have been performed in order to evaluate the exact overhead introduced by HTTPS on the gCube infrastructure.
Performance tool
In order to measure performance of the infrastructure by using HTTP and to evaluate the exact overhead by using HTTPS we used Apache JMeter. A small set of workload generator and data collection bash scripts have been produced. These scripts issue HTTP(S) requests with a SOAP body for loading up a particular service and collect statistics on latency. Besides, a small set of scripts to generate reports and charts using JMeter libraries have been used.
Test plans
In order to evaluate the overhead produced by using HTTPS connection several tests were carried out. The following test plans have been used:
1. 100 HTTP requests over 100 seconds
2. 100 HTTP requests over 10 seconds
3. 100 HTTPS requests over 100 seconds
4. 100 HTTPS requests over 10 seconds
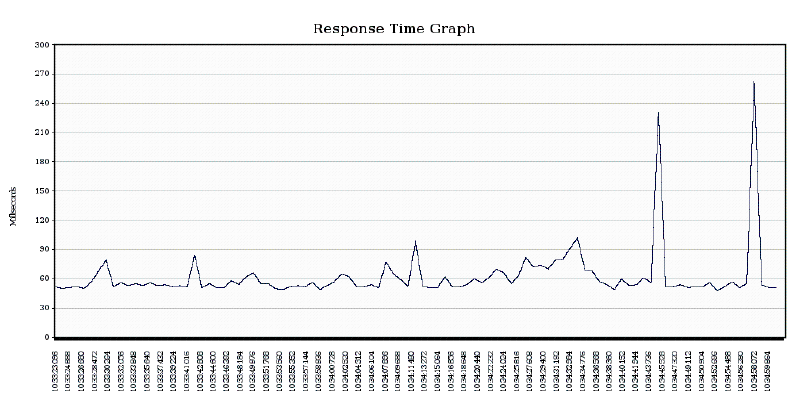
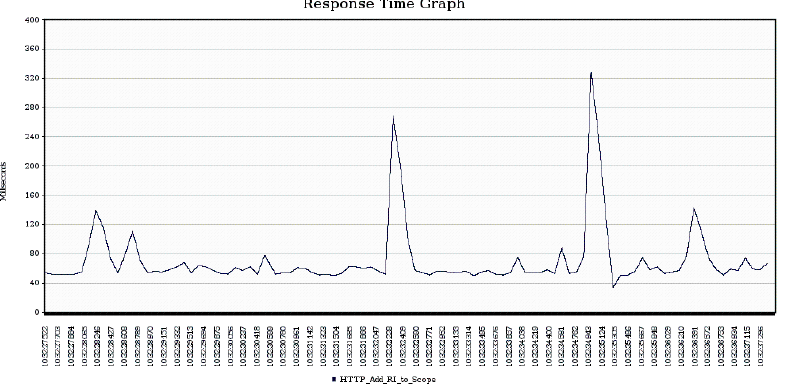
Test plans 1 and 2 have been performed on a non-secure GHN (gcube-testing-node1).
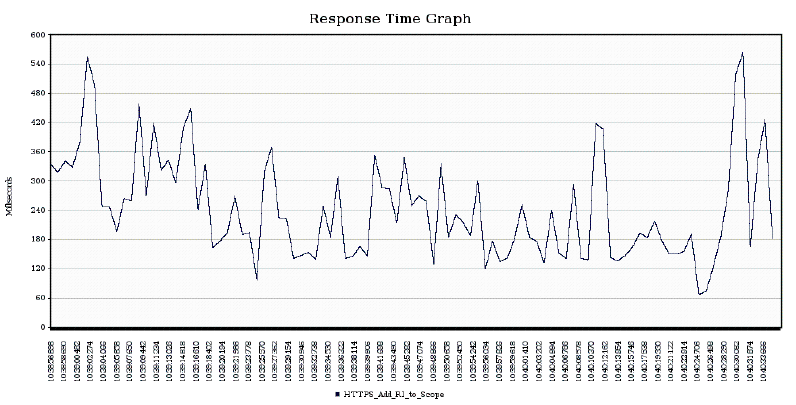
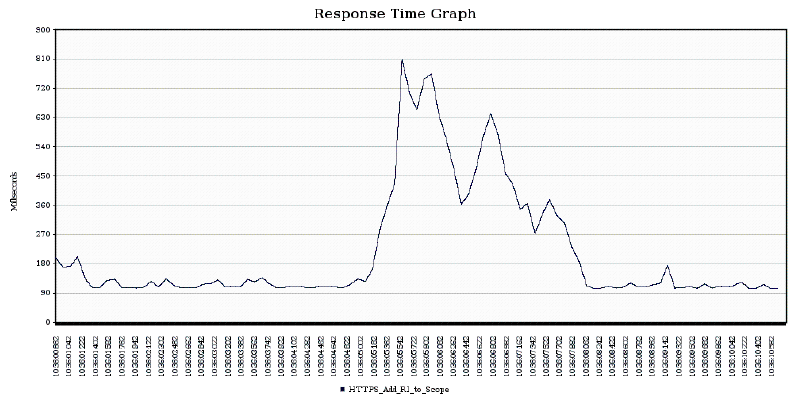
Test plans 3 and 4 have been performed on a secure GHN (gcube-testing-node2).
Each request consists on a simple HTTP(S) request, with a SOAP body, to the GHN Manager service. In particular, a single request is an addRItoScope operation, which takes as input a valid scope expression, a service name and a service class; the scope is assigned to the local instance identified by the given name and class.
Results
In this section the results of the tests presented above are summarized and commented, focusing on the response time. The mean values are presented here in tables, the detailed graphics are shown in the appendix. Tables 1 and 2 summarize the overall performance of the addRItoScope operation using an HTTP connection and an HTTPS connection.
| HTTP | ||
|---|---|---|
| Time range (s) | 100 | 10 |
| Average (ms) | 62 | 70 |
| Min (ms) | 48 | 34 |
| Max (ms) | 263 | 329 |
| 90th%ile (ms) | 77 | 102 |
| HTTPS | ||
|---|---|---|
| Time range (s) | 100 | 10 |
| Average (ms) | 242 | 113 |
| Min (ms) | 67 | 104 |
| Max (ms) | 564 | 808 |
| 90th%ile (ms) | 407 | 472 |
The tables show that the average response time is 62ms with an HTTP connection and 242ms with an HTTPS connection for the test plans 1 and 3. On the other hand, for the test plans 2 and 4 the tables show that the average response time is 70ms with an HTTP connection and 113ms with an HTTPS connection. In the case of an HTTP connection (with 100 HTTP requests over 100 seconds) the average response time varies between 48ms and 263ms, and for the 90% of the samples the response time is less than 77ms. In case of an HTTP connection (with 100 HTTP requests over 10 seconds) the average response time varies between 34ms and 329ms, and for the 90% of the samples the response time is less than 102ms.
In case of an HTTPS connection (with 100 HTTPS requests over 100 seconds) the average response time varies between 67ms and 564ms, and for the 90% of the samples the response time is less than 407ms. In case of an HTTPS connection (with 100 HTTPS requests over 10 seconds) the average response time varies between 104ms and 808ms, and for the 90% of the samples the response time is less than 472ms. The following table summarizes the overhead percentage introduced by using an HTTPS connection:
| Time range (s) | 100 | 10 |
|---|---|---|
| Average % | 74.38 | 38.05 |
| Min (ms) | 28.36 | 67.31 |
| Max (ms) | 53.37 | 59.28 |
According to these results, the overhead introduced (on the average response time) by using an HTTPS connection is equal to 74.38% with respect to the test plan with 100 requests over 100 seconds, and is equal to 38.05% with respect to the test plan with 100 requests over 10 seconds.
Appendix


